Machine Downtime Cost Calculator
For a machine or production line: what one stopped hour costs, per stop and per year, with a one page business case. The second tab works out downtime percent and availability, with planned stops handled. Numbers update as you type.
Updated October 2026
Your downtime
One machine or line, a typical month. What counts as each input
What one stopped hour costs
Your one page business case
Name the line, set how much of the downtime a fix should remove and, if you know it, what the fix costs. Then print the case or save it as a PDF from your browser's print dialog. Nothing is sent anywhere.
The case rests on your own numbers. Before you print it, check what to leave out and the sourced benchmarks below.
Your machine or line
One period, one time unit for every number. How planned stops are handled
Mark: 90% world-class availability, traced to Nakajima (1988). Sources
Where the scheduled time went
Unplanned downtime against a NIST survey
Unplanned downtime as a share of planned production time in US discrete manufacturing, 2016 survey data: 4.0% in the quarter of plants with the least reactive maintenance, 7.8% on average, 13.0% in the most reactive quarter (NIST AMS 100-34, Tables 5.1 and 7.2). Your marker: -.
Want a second look at this result?
Leave your work email if you would like the OEE Lab team to get in touch about your numbers. To keep the result, use Copy link or Print above.
No newsletter, no spam.
This number says what downtime costs, not why it happens.
A calculator prices the hours you type in. Fabrico, a light MES, tracks OEE and downtime live from PLCs or IoT sensors, with add-on AI cameras counting output where a machine has no usable signal. Where cameras are fitted, the video of any stop can be streamed on request next to its machine data.
Request a demo Contact usHow to calculate the cost of machine downtime
Cost per stopped hour = lost production + idle labor + other costs
No neutral source publishes a cost per stopped hour that fits one plant, so the formula adds up the three costs a stopped hour causes on your own line. The cost of downtime is more than the sales you missed. Work it out for one machine or line in four steps:
- Lost production per hour = output rate × contribution margin per unit. Use the rate the line normally runs at, and the margin, not the price.
- Idle labor per hour = operators who wait × their loaded hourly rate. They are paid while the machine stands still.
- Other costs per hour: scrap made while the line restarts, energy that keeps running, the repair crew's time and parts, expedited freight and the overtime to catch up.
- Cost per year = cost per hour × downtime hours a month × 12. Cost per stop = the monthly cost ÷ the number of stops a month.
What counts as each input
| Input | Count it | Leave it out |
|---|---|---|
| Unplanned downtime | Stops nobody planned while the machine was meant to run: breakdowns, jams, waiting for material, an operator or a quality release | Breaks and time with no orders; changeovers, which the changeover cost calculator prices |
| Unplanned stops | Each separate stop in the month | Short stops nobody logs; they show up as slow running instead |
| Output rate | Good units per hour at the rate the line normally runs | The nameplate or ideal rate, which inflates the loss |
| Margin per unit | Contribution margin: the selling price minus materials, packaging and other variable costs | The full selling price, and fixed overheads that run whether the line stops or not |
| Idle operators | People who wait at the line during a stop | People moved to other useful work while it is down |
| Loaded labor rate | Wage plus payroll taxes, benefits and shift premiums | Overhead allocations |
| Other costs | Restart scrap, energy and utilities that keep running, the repair crew's hours (see mechanic pay by state, BLS) and spare parts, expedited freight, overtime to make up the output | Lost customers and delivery penalties, which are real but cannot be priced per hour |
How to calculate machine downtime and availability
Downtime % = unplanned downtime ÷ planned production time
Availability = run time ÷ planned production time
- Planned production time = scheduled time minus planned stops: breaks, meetings and time with no orders.
- Run time = planned production time minus unplanned downtime minus changeovers and setups.
Availability is the first factor of OEE, which comes from Seiichi Nakajima's total productive maintenance programme (Muchiri and Pintelon, 2008). Downtime percent is the share the NIST survey below asked plants for in its question 9, so your figure is measured the same way. Planned stops come out before anything is divided, the same rule as the machine availability calculator.
The rule matters more than people expect. In the worked example, availability is 89.8% with the breaks taken out and 84.2% if the breaks count as downtime. Both are arithmetic, but the two cannot be compared, so pick one rule, write it down and keep it for every machine and every month.
Worked example: a bottling line, one month
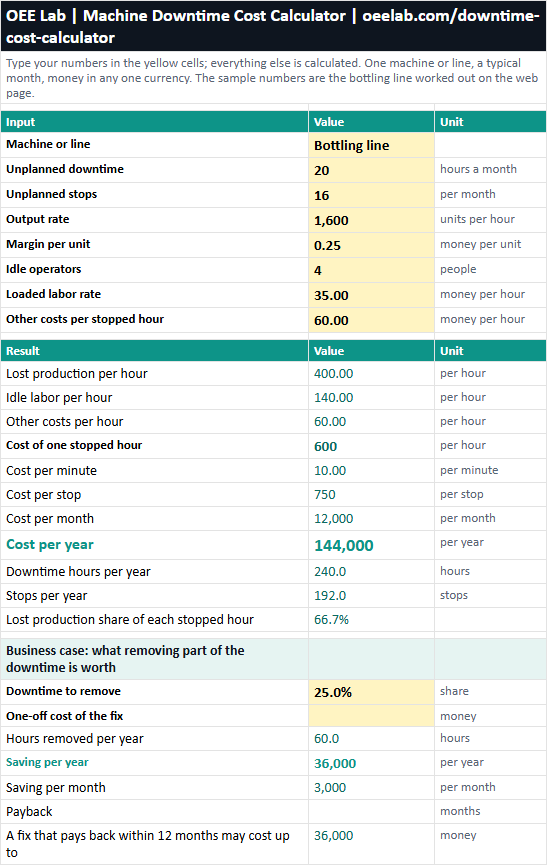
A bottling line in a beverage plant runs two 8 hour shifts a day, 21 days a month: 336 scheduled hours. Breaks take 30 minutes a shift, 21 hours a month. Changeovers take 12 hours, and 16 unplanned stops take 20 hours: a filler fault, labeller jams, waiting for empty bottles. The line normally runs 1,600 bottles an hour at a contribution margin of 0.25 a bottle, 4 operators wait during a stop at a loaded rate of 35 an hour, and each stopped hour costs another 60 in restart scrap, energy and expediting. Money is in any one currency.
| Step | Calculation | Result |
|---|---|---|
| Planned production time | 336 - 21 | 315 h |
| Run time | 315 - 20 - 12 | 283 h |
| Unplanned downtime | 20 ÷ 315 | 6.3% |
| All stops, with changeovers | (20 + 12) ÷ 315 | 10.2% |
| Availability | 283 ÷ 315 | 89.8% |
| Lost production per hour | 1,600 × 0.25 | 400 |
| Idle labor per hour | 4 × 35 | 140 |
| Cost of one stopped hour | 400 + 140 + 60 | 600 |
| Cost per stop | 600 × 20 ÷ 16 | 750 |
| Cost per year | 600 × 20 × 12 | 144,000 |
At 6.3% of planned production time, the line sits below the 7.8% average in the NIST survey, and its availability of 89.8% is just under the 90% world-class figure. Lost production is two thirds of every stopped hour, so the stops cost far more than the people waiting. Removing a quarter of the unplanned downtime gives back 60 hours and 36,000 a year, so a fix that costs less than 36,000 pays back within a year. That is the case the business case printout puts on one page.
Downtime benchmarks, with their sources
These downtime figures have a neutral source, and each is shown with the scope it was measured in.
| Figure | What it measured | Source |
|---|---|---|
| 7.8% of planned time | Unplanned downtime as a share of planned production time, average, US discrete manufacturing, 2016 survey data | NIST AMS 100-34 (Thomas and Weiss, 2020), Table 5.1 |
| 4.0% and 13.0% | The same share in the quarter of plants with the least reactive maintenance and in the most reactive quarter: 3.3 times more downtime | NIST AMS 100-34, Table 7.2 |
| 31.7% | Share of that unplanned downtime that was due to maintenance issues | NIST AMS 100-34, Table 5.1 |
| $18.1 billion | What maintenance-related downtime cost US discrete manufacturers in 2016 (90% confidence interval $9.4 to $29.5 billion) | NIST AMS 100-34, Executive Summary and Table 5.1 |
| 90% availability | The availability part of the 85% world-class OEE (90% × 95% × 99%), the figure usually traced to Seiichi Nakajima's Introduction to TPM (1988). A target, not an average. | Nakajima (1988); OEE's origin in his TPM programme per Muchiri and Pintelon (2008) |
| 35% to 45% | Reduction in downtime that unnamed independent surveys credit to a working predictive maintenance programme, as cited by a federal guide | US DOE, O&M Best Practices Guide, Release 3.0 (2010), p. 5.4 |
NIST asked US discrete manufacturers about 2016, and the DOE guide does not name its surveys, so read each figure with its scope. Use the survey figures for scale, not as a target for one machine. More sourced figures are in the manufacturing downtime statistics.
Common mistakes when calculating downtime cost
- Pricing lost output at the selling price. A stopped line also stops buying the materials, packaging and energy for the units it does not make. Use the contribution margin per unit.
- Counting output that is made up later. If the plant catches up with overtime or a weekend shift, the lost margin comes back and the real cost is that overtime. Put it in other costs and set the margin to what is truly lost.
- Using the nameplate rate. A line that never runs at its ideal speed does not lose ideal output when it stops. Use the rate it normally runs at.
- Leaving idle labor out because the operators are paid anyway. That is exactly why it is a cost of the stop: the hours are paid and nothing is made.
- Moving planned stops in and out of downtime. Breaks counted as downtime on one line and left out on another make the two downtime percentages meaningless side by side. Keep one rule.
- Quoting a headline figure instead of your own. Siemens' vendor survey, The True Cost of Downtime 2024, puts an hour in a large automotive plant at $2.3 million, extrapolated from 181 interviews, and the often quoted $50 billion a year in Deloitte's 2017 article traces back to Emerson-sponsored content. Neither says what an hour costs on your line.
- Averaging downtime percentages across machines. Add up the hours of all machines and divide once, or a machine that ran half the month counts as much as one that ran all of it.
Machine downtime cost calculator in Excel (free download)
Prefer a spreadsheet? The same calculator as an Excel workbook, with no macros and no sign-up:
- Downtime cost sheet: the seven inputs in yellow cells, the cost per hour, per minute, per stop, per month and per year, and the business case with the saving and the payback of a fix.
- Downtime and availability sheet: scheduled time, planned stops, unplanned downtime and changeovers, with downtime percent, availability, the NIST comparison and the hours a month to carry into the cost sheet.
- Several lines sheet: up to 15 machines or lines, the cost of each per hour and per year, and a plant total from summed hours.
- Notes sheet: the formulas, what counts as each input and the sources.
To record every stop with its reason, use the downtime log template.
Download the Excel version (.xlsx, 18 KB)
When one machine keeps stopping
Most downtime is a handful of causes that repeat. Log each stop with its reason for a few weeks, then start with the biggest one. The troubleshooting directory has a guide per machine, for example packaging line, labelling machine, palletizer and, on food lines, blast freezer troubleshooting. Size failures and repairs with the MTBF and MTTR calculator, the short stops nobody logs with the hidden factory calculator, and read planned vs unplanned downtime and how to reduce unplanned downtime.
Downtime calculator FAQ
How do you calculate the downtime of a machine?
Take the planned production time, which is the scheduled time minus planned stops such as breaks, and divide the unplanned downtime by it. Availability is run time divided by planned production time. In the worked example, 20 hours of unplanned downtime in 315 planned hours is 6.3%, and availability is 89.8%.
What is the formula for the cost of downtime per hour?
Cost per hour = output rate × contribution margin per unit + idle operators × loaded labor rate + other costs per hour, such as restart scrap, energy, repairs and expediting. Multiply it by the downtime hours to get the cost per month or per year. A line making 1,600 units an hour at a margin of 0.25, with 4 idle operators at 35 an hour and 60 of other costs, loses 600 an hour.
Should planned downtime count in the downtime percentage?
Breaks, meetings and time with no orders usually do not: take them out of planned production time first. Changeovers and setups are planned too, but they happen while the machine is meant to run, so they count against availability. This calculator shows unplanned downtime on its own, all stops with changeovers, and what availability would be if planned stops counted as downtime.
How much unplanned downtime is normal in manufacturing?
In a NIST survey of US discrete manufacturers (2016 data), unplanned downtime took 7.8% of planned production time on average. The quarter of plants that relied most on reactive maintenance lost 13.0%, the quarter that relied on it least lost 4.0%. Compare a machine with its own trend first, measured the same way every month.
How much does downtime cost in manufacturing?
There is no single figure, because it depends on what the line makes and who waits while it stands. For scale, NIST estimated that maintenance-related downtime cost US discrete manufacturers $18.1 billion in 2016. The bottling line in the worked example loses 144,000 a year from 20 stopped hours a month. Late delivery penalties, lost customers and safety risk are left out, so treat any such result as a floor.
How can I track downtime for equipment?
Write down every stop when it happens: the machine, the date, the start time, the minutes it lasted, the reason, and whether it was planned or unplanned. Then total the minutes by reason each month to see which cause costs most. The free downtime log template does this in Excel with a reason Pareto, and the free OEE app keeps the same record shift by shift, typed in by hand, in your browser.
Is there an Excel version of this downtime calculator?
Yes. The free workbook has the downtime cost sheet with the same inputs and the business case, the downtime and availability sheet, a sheet for up to 15 lines with a plant total, and a notes sheet with the formulas and sources. It has no macros and needs no sign-up.
Related: availability calculator · OEE calculator · the cost of downtime, explained